
INDUSTRY REPORT
Q3 2025: Home & Kitchen Category Performance Analysis
Home & Kitchen brands saw Ordered Product Sales increase 7% year over year in Q3 2025. But beneath the surface, unit margins declined 3.79% as promotional activity and rising operational costs compressed profitability.


Key takeaways
- Margins contracted despite sales gains: OPS rose 7% YoY, but margins fell 3.79%, reflecting Prime Day discounting & structural cost pressure
- Inventory built but gaps remain critical: On-hand inventory grew 18% & fill rates hit 10.5% improvement, yet OOS revenue loss jumped 13.4% on high-value items


- Traffic declined in peak selling period: July was the only month with YoY traffic decline at 3.2%, despite being a tentpole event month
- Ad spend increased without efficiency gains: Marketing investment climbed 8.1% YoY while ROAS dropped 0.9% & CPCs rose 5%, showing platform competition intensified
- Pricing power emerged but margins didn't follow: ASPs peaked in July with 6.4% YoY growth & discounts hit 18-month lows, yet profitability still declined
- OOS impact concentrated on key SKUs: Revenue loss from stockouts rose 13.4% despite lower OOS rates, indicating availability gaps on top-performing products
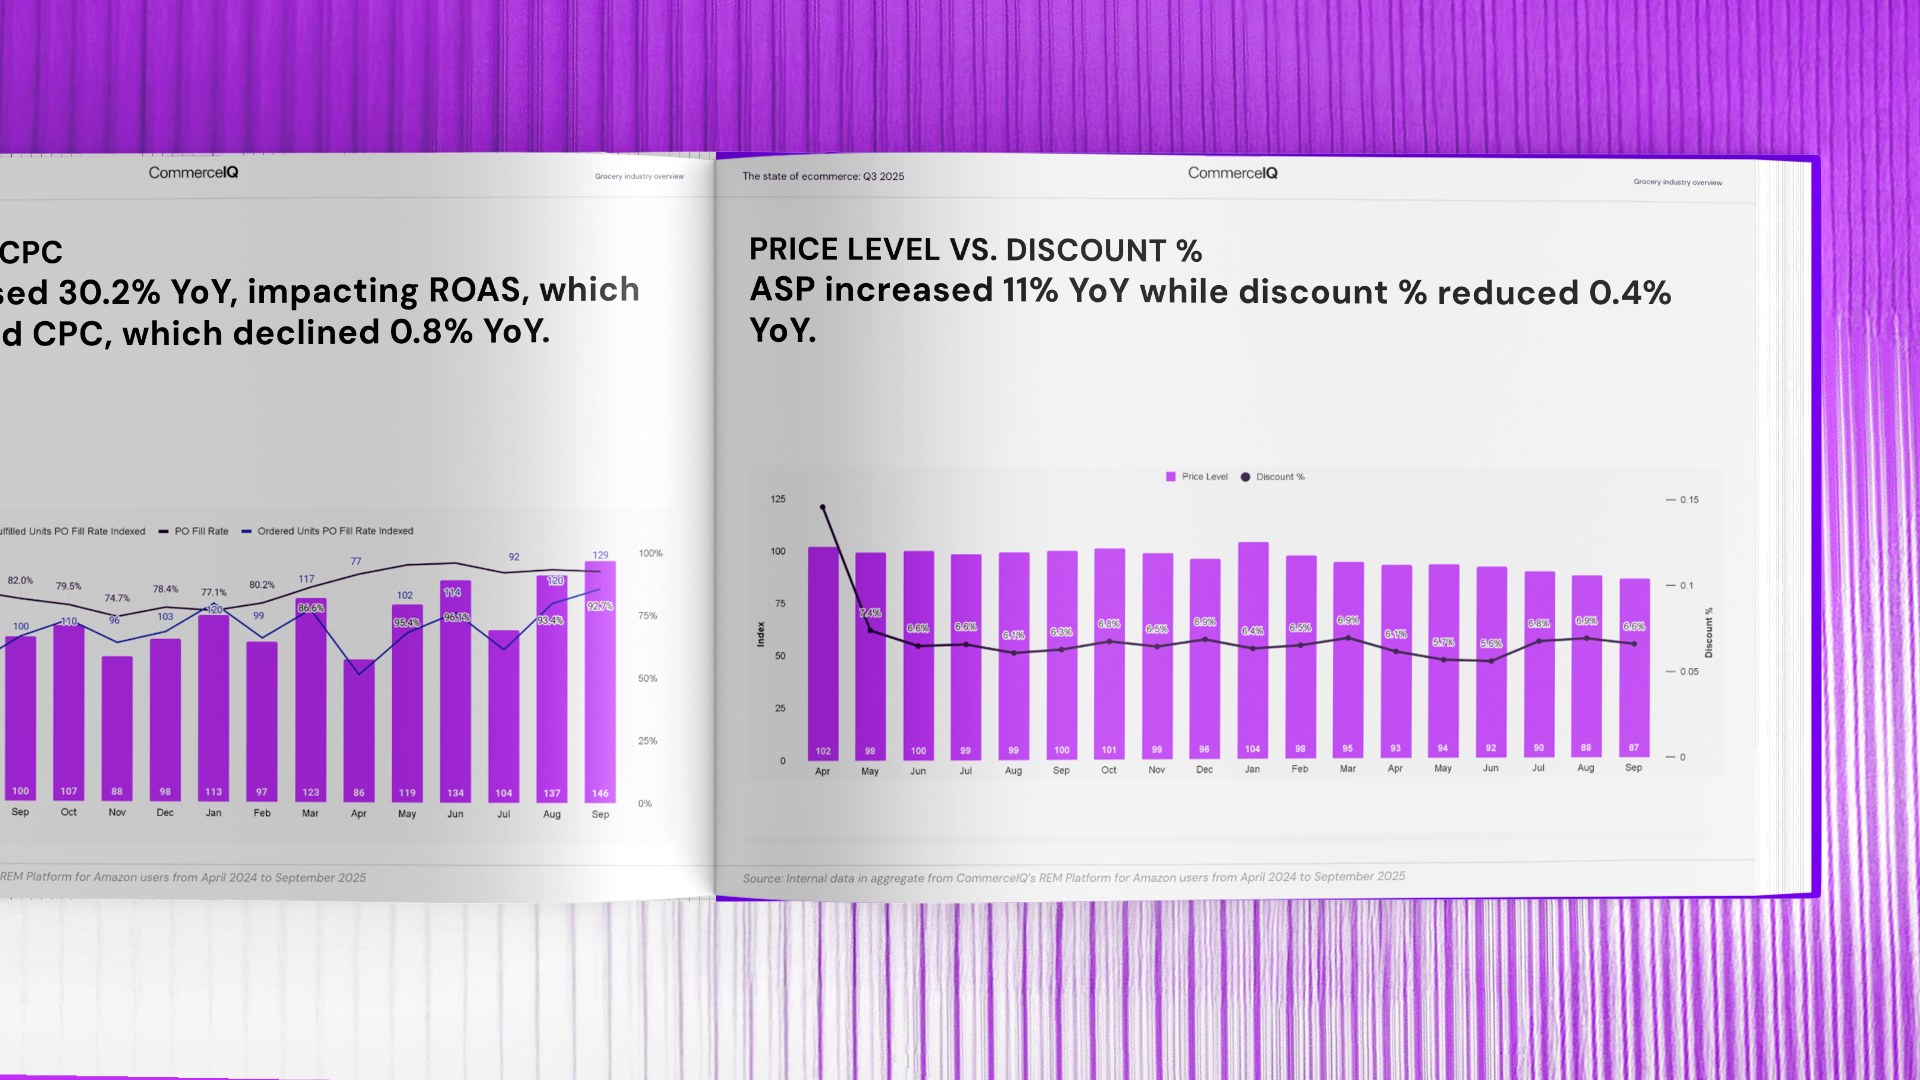
Q3 2025: Home & Kitchen Category Performance Analysis
Home & Kitchen: Modest sales growth masked by rising costs & declining traffic. Get the Q3 2025 Home & Kitchen ecommerce report now.
Download now