
INDUSTRY REPORT
Home & Kitchen market resilience in Q2 2025
Q2 2025 defied expectations for the Home & Kitchen category. Despite economic headwinds and supply chain challenges, the data reveals a resilient sector with surprising growth patterns. While conventional wisdom might have predicted declining sales, the numbers tell a more complex story where operational excellence and cost management have become crucial differentiators.


Key takeaways
- Inventory increased significantly: Q2 saw a 43% year-over-year increase in on-hand inventory, indicating substantial investment in stock levels.
- Average selling prices rose: Unlike many other categories, Home & Kitchen average selling prices increased 2.7% year-over-year as discounting remained at 18-month lows.


- Traffic growth outpaced sales: Glance views increased 15% year-over-year, while sales grew 9.5%, highlighting room for conversion rate optimization.
- Advertising efficiency improved: Ad spend declined 8.9% year-over-year while maintaining stable return on ad spend (ROAS) and cost per click (CPC), suggesting more effective ad strategies.
- Supply chain improvements emerged: Revenue loss due to out-of-stock issues decreased 7.2% year-over-year as RepOOS% hit an 18-month low.
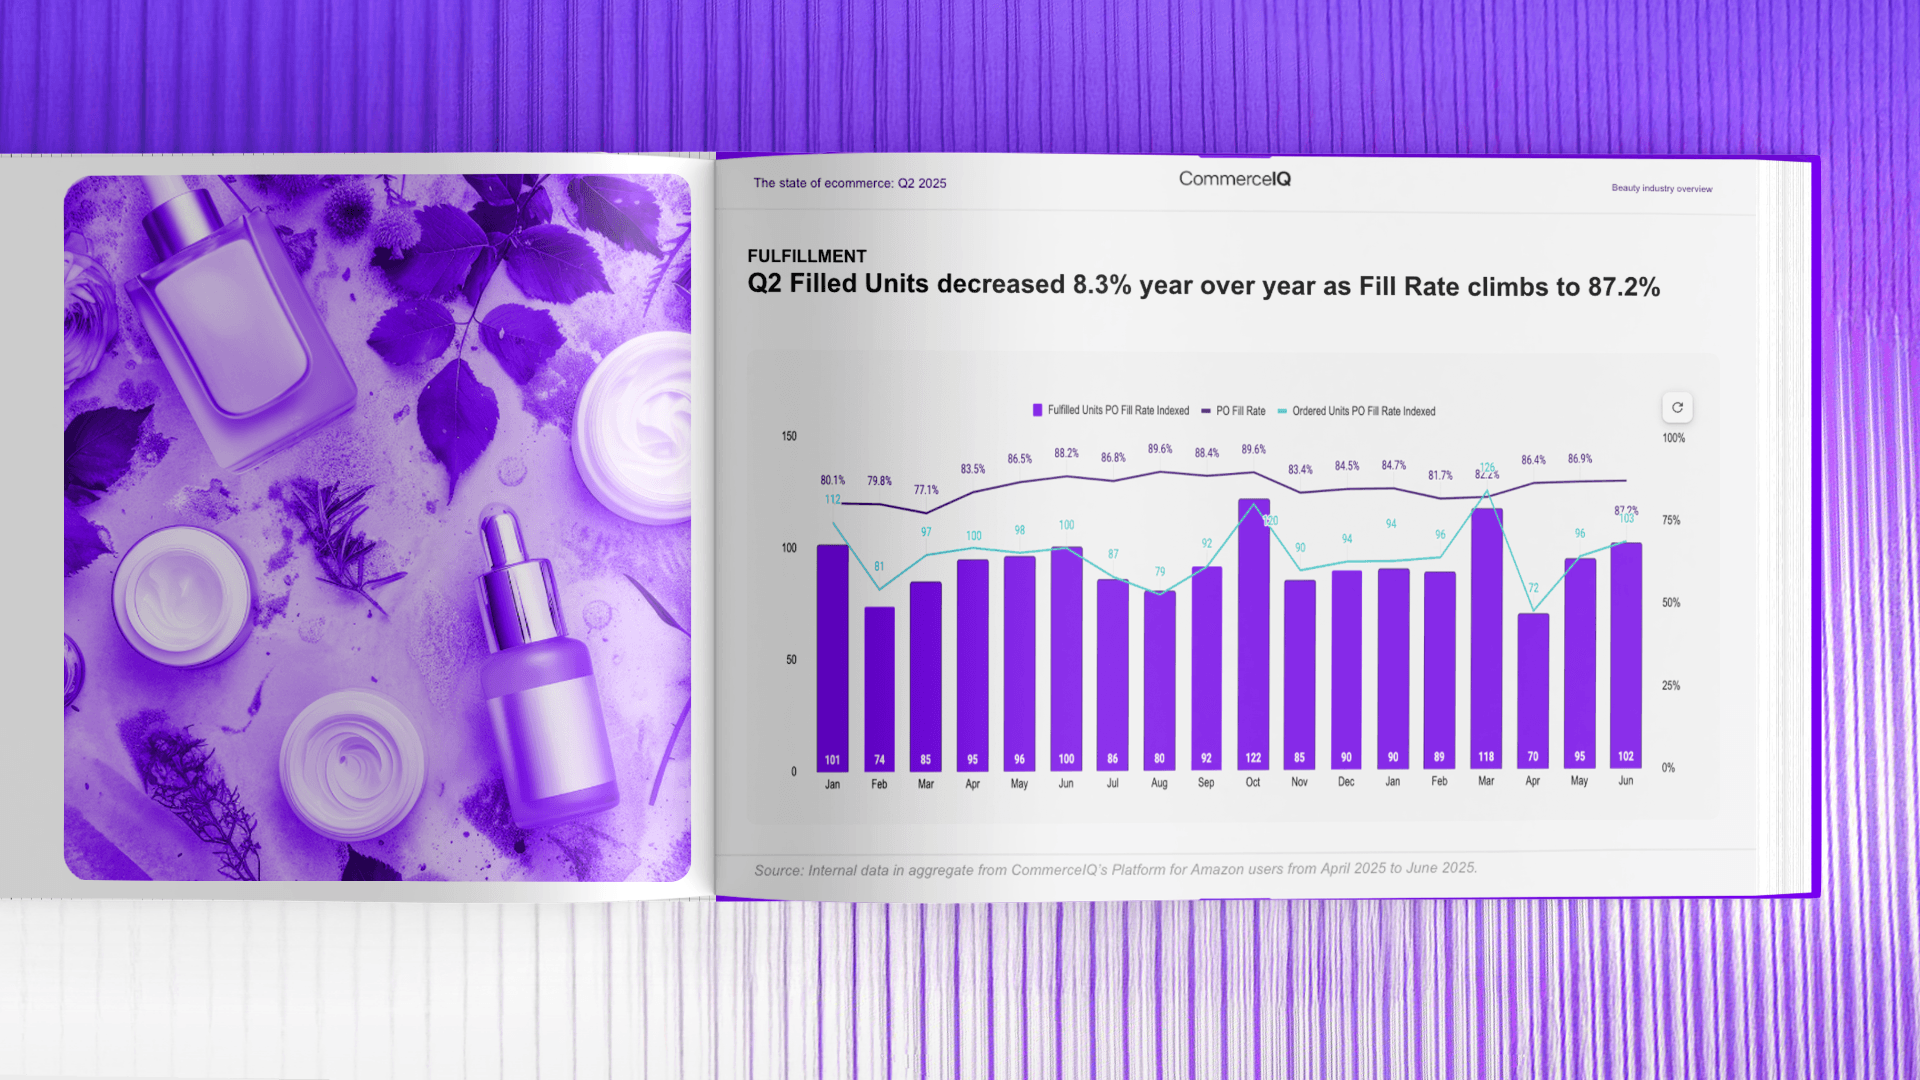
- Fulfillment challenges continued: Q2 filled units declined 27.4% year-over-year as fill rate dropped to 57.4%, indicating ongoing fulfillment challenges.
Home & Kitchen market resilience in Q2 2025
Despite economic and tariff challenges, data reveals surprising resilience and shifting priorities across ecommerce platforms. Get the Q2 2025 Home & Kitchen report now.
Download now