Introduction:

Ever had issues in dealing with a distributed system while at the same time looking for proper metrics to track both engineering and operational performance? If yes, do read on.
When dealing with a truly distributed system, debugging an issue becomes a painful and time consuming operation. The biggest pain point becomes going through logs for various systems individually and scrolling and searching through millions of logged events. At the same time perform the root cause analysis and measure the impact in upstream and downstream systems.
CommerceIQ deals with multiple automation systems such as Hourly Bidder, Campaign Optimiser, Budget Optimiser etc., generating millions of actions (bid change, budget changes, status changes etc.) throughout the day. Tracking all of these actions is hard. This is because each automation system has a group of microservices with their own way of logging events. The problem statement was to capture important events, if not all. This would help not only with debugging issues but also with preparation of various actionable reports.
CommerceIQ’s Retail Media Management (RMM) product has a wide range of automation features, which generates 6-7 Million actions per day on retailer APIs (Bid changes, Budget changes, Pause/Activate campaigns etc.). These actions perform various internal operations such as filtering, mathematical calculations, payload preparation etc. in different systems. Around 10+ services interact together to perform 1 automated action in RMM which means debugging a single error/issue can take up to hours by logging into various systems.
In this blog post, we explain how we at CommerceIQ solved event based logging for big/large scale groups of services with minimum latency.
The Proposal:

We went with a simple design approach which could auto scale as well as scale on demand. The main goal of the design was to consume millions of events coming and persist them with minimum possible latency. We wanted to have a database service which could not only support very high IOPS with low latency but also auto scale with load. As the incoming messages vary for each action type, we needed flexibility in order to support new action types. Since all our requests will be saved in JSON we can opt for a NoSQL database which would provide query capabilities with nested JSON objects. We compared 3 database options for this project:
- ElasticSearch
- MongoDB
- DynamoDB

We decided to go ahead with MongoDB over other two for the following reasons:
- The system will have a very high write OPS throughput (as per current action load, peak OPS load will be 5000 write ops per second, this will increase with time)
- MongoDB supports Search capabilities with Apache Lucene same as elasticsearch
- Autoscale capabilities without any downtime with MongoDB Atlas
- Cold Storage option with S3 for auto archival, this allows the retrieval queries to be fast as they will be traversing on a smaller dataset. The older dataset is also readily available for analysis with the Data Federation in MongoDB Atlas.
- Read-only SQL queries via the MongoDB Connector for BI (Compatible with Tableau)
- Out of the box MongoDB charting capabilities
- Ease of building REST APIs for various use cases
Note: Please refer to links at the bottom.
The solution has 3 components:
- AWS SQS: The message queue will receive events from all services in a specified format
- Action Logger: This service will be consuming the messages and persisting them to the related database
- MongoDB: This will be the datastore for storage of all events

The simplicity of the design allows the system to be horizontally scalable.
The Challenges:
There were still a few challenges which had to be overcome in order for this solution to become viable:
- How to ingest 20-30M events per day with peak IOPS being 5000?
- How to overcome concurrency limitations in message consumption?
- How to utilize DB connections effectively without putting strain on the database?
For context, we went against using AWS lambda due to the above mentioned challenges as even if you batch the messages in AWS lambda, there is a cap on the number of messages that can be read in one go, additionally each AWS lambda will create a new connection of its own and then insert messages.
For each database there is a fixed number of database connections (it depends on infra configuration) that can be opened at any given time, even if we trigger connection closure, it takes some time for that connection to be available again.
With the ec2 system we would be able to solve for the database connection pool (with reusable connections) but it would not be able to keep up with incoming messages because there is a cap of 10 messages that can be read in one go.
The Solutions:
Reducing latency in message consumption:There are traditionally 2 approaches to consume messages from SQS:
- Via @SqsListener in Spring cloud
- A scheduled listener which polls after a fixed frequency
Both solutions in themselves have multiple benefits and solve specific use cases, but for this problem statement, both had drawbacks.
@SqsListener has very low polling latency but can only read 1 message at a time and although a scheduled listener can read max 10 messages in one go, it needs fine tuning and is limited by scheduler which needs fine tuning to reach an optimal solution.
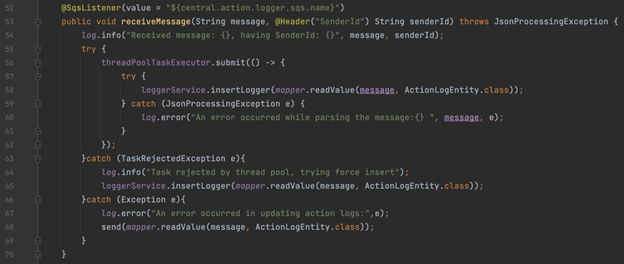
To work around this problem we used the Java ThreadPoolTaskExecutor in order to increase the parallel consumption within the Message listener. By treating the message processing logic as an atomic individual task, we use Java Thread Pooling to induce parallelism in processing each message quickly.
Effective use of Java Threadpool:
Parallel processing i.e. parallel threads are one of the most underutilized concepts in Java. This is a very powerful tool if used properly, it allows you to utilize the maximum out of the provided server capabilities. We generally follow a few thumb rules while using Java Threadpool i.e. the maximum number of threads should be less than or equal to 2 times the number of cores. This is more of a suggestion and with different use cases it can end up either throttling the application or letting the server resources be underutilized.
Note: For all discussion below we will be referring to Spring framework ThreadpoolTaskExecutor
- Core Pool Size: The corePoolSize is the minimum number of workers to keep alive without timing out i.e. minimum active threads at all times.
- Max Pool Size: The maxPoolSize defines the maximum number of threads that can ever be created for that thread pool.
- Queue Capacity: The queueCapacity defines the waiting queue for tasks. If not set, it picks a default value which is Integer.MAX_VALUE, which can cause a memory leak if not handled correctly; so it's a double edged sword. This is a factor of rate of consumption of threads and rate of generation of incoming requests, this should be large enough to consume all incoming requests.
The number of threads in a pool is a factor of the problem one is trying to solve. We have put these problems into 3 categories (provided the service is executing only these threads):


Results:
Using the above mentioned approaches we were able to process close to 25M messages everyday with peak 5000 IOPS and low latency (<1s for 99.99%). Artifacts attached below.
MongoDB:
- 8 vCPU, 32 GB
- 3 node cluster

SQS:


- 4 vCPU, 16 GB
- 3 pods
CPU Utilization:

Memory Utilization:

Ref:
- Amazon DynamoDB vs. Elasticsearch vs. MongoDB Comparison
- Elasticsearch vs MongoDB: 6 Key Differences
- MongoDB vs DynamoDB Head-to-Head: Which Should You Choose?
Author: Navneet Prabhakar, Sr. Software Development Manager (RMM)