
Q2 2026 INDUSTRY REPORT
The State of Ecommerce: Pet Products
The standout supply chain story, with OOS losses down despite Prime Day
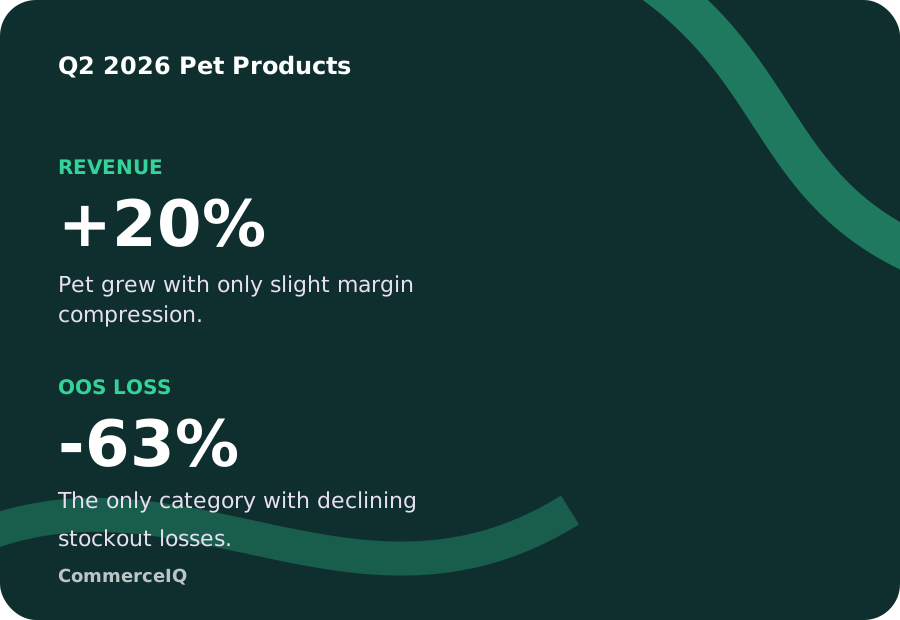
- OOS revenue loss fell 63% while revenue grew 20%, the only category where stockout losses declined despite Prime Day.
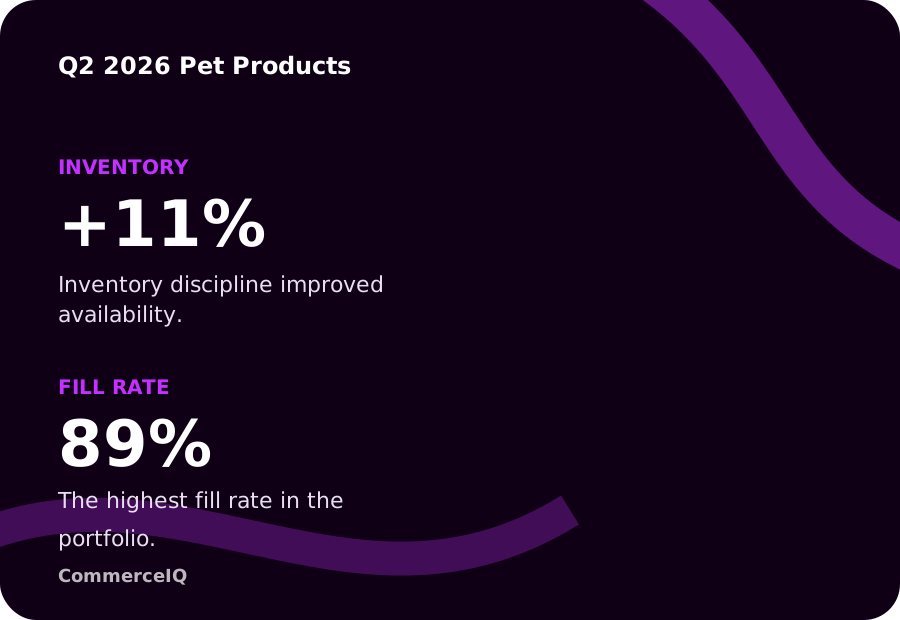
- Fill rate improved to 89%, the highest of any category, with the lowest discount rate in the portfolio.
- Pet grew volume without sacrificing margin or availability. Get the data behind the supply chain execution driving the difference.
Download the full category report for the Q2 2026 benchmarks and recommendations.
Key takeaways
Pet has the best in-stock story.
Inventory rose 11% YoY while Rep OOS improved to 1%, the best in-stock rate in the portfolio.
Supply chain kept pace with demand.
Fulfilled units grew 16% YoY and fill rate improved 1pp to 89%, the highest across categories.
Pricing power is holding.
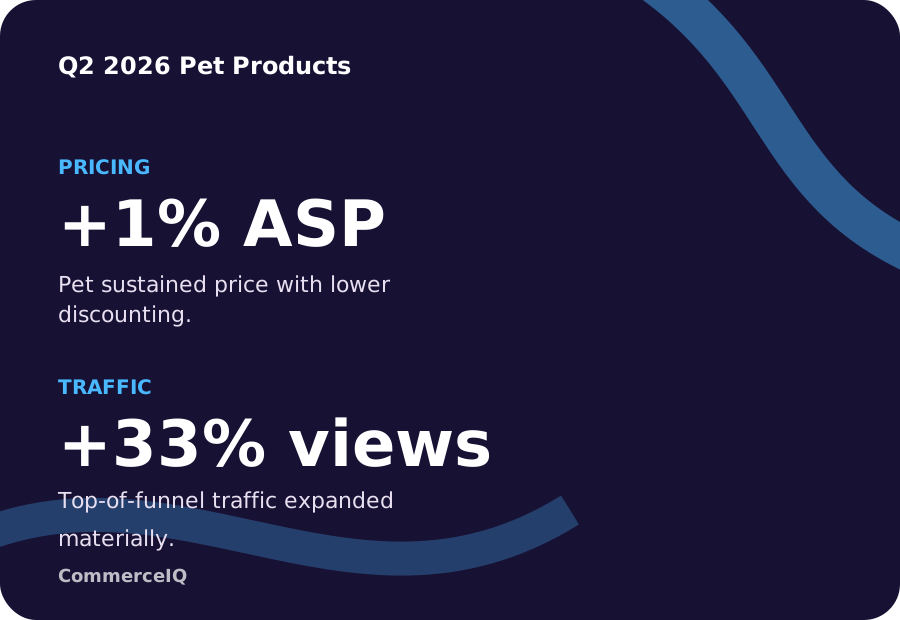
ASPs rose 1% while discount rate fell to 3.8%, the clearest indicator of pricing power.
Traffic growth broadened the funnel.
Glance views rose 33% YoY while conversion fell 6pp, but Pet still held the highest CVR of any category.
Pet balanced growth and margin.
Revenue grew 20% YoY while gross margin fell only 1pp to 30%, a strong growth-to-margin trade-off.
Stockout losses fell despite Prime Day.
OOS revenue loss declined 63% YoY while revenue grew 20%, confirming a genuine supply-chain win.
Get your Q2 2026 Pet Products State of Ecommerce Report
Download the Q2 2026 State of Ecommerce report for Pet Products insights on growth, margin, media efficiency, pricing, and availability.
Download now