
Q2 2026 INDUSTRY REPORT
The State of Ecommerce Report
Prime Day timing, margin pressure, and the hidden cost of growth.
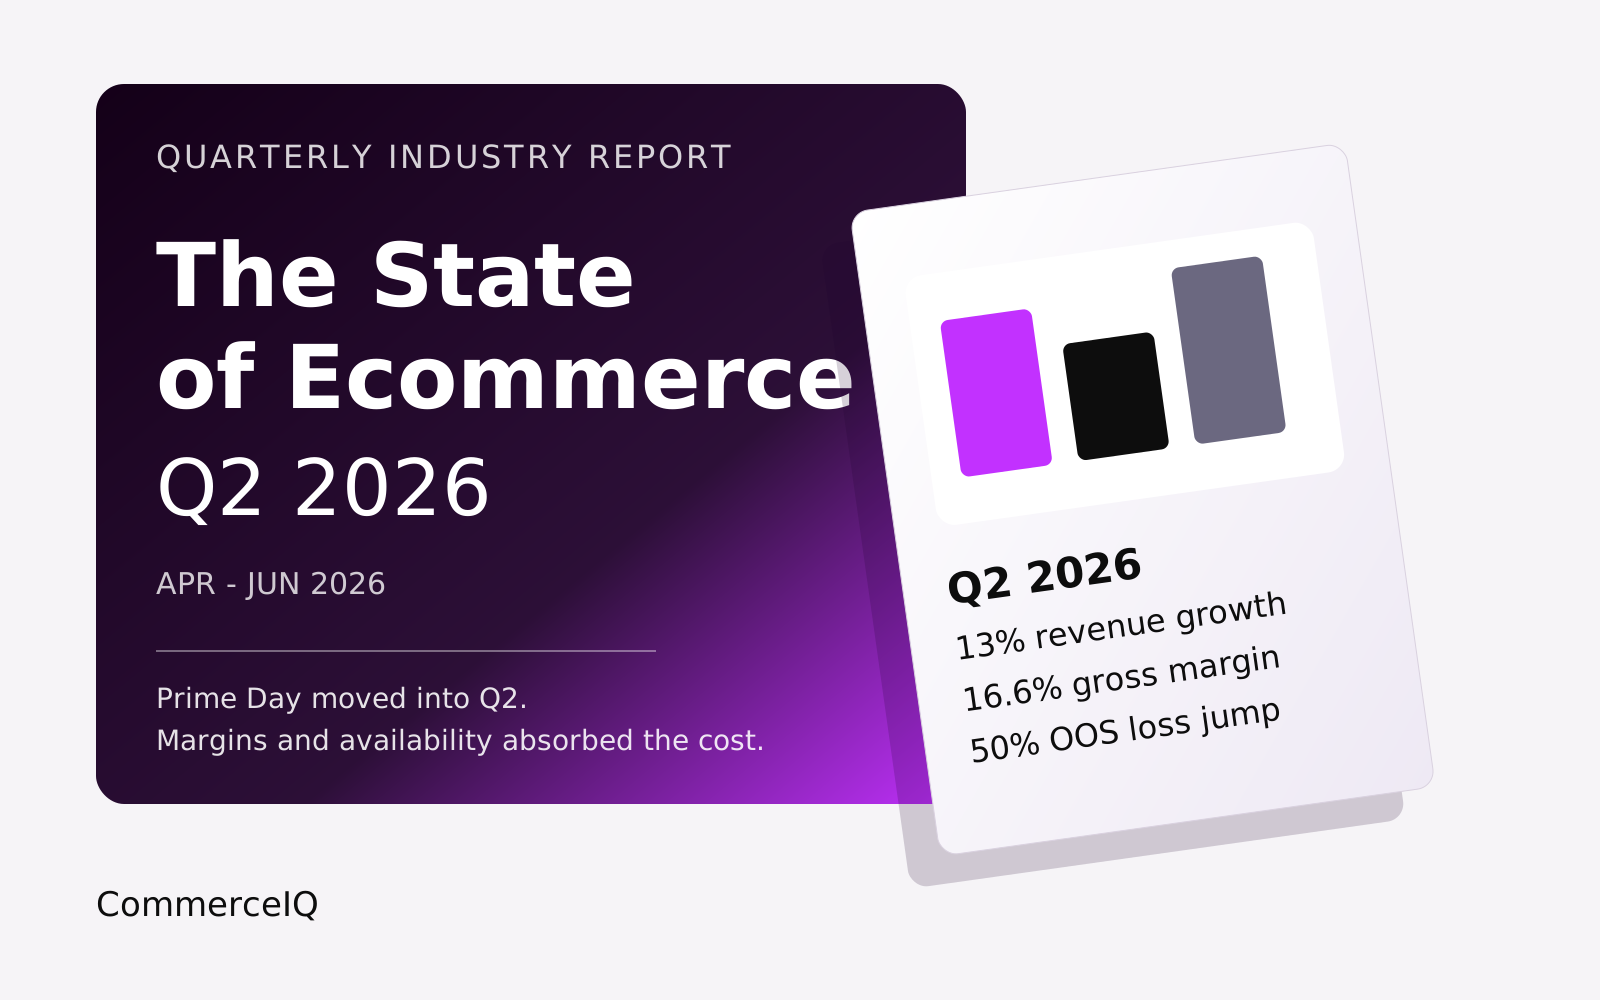
Q2 2026 marks a quarter defined by one distorting event and two structural trends brands can't Prime-Day their way out of:
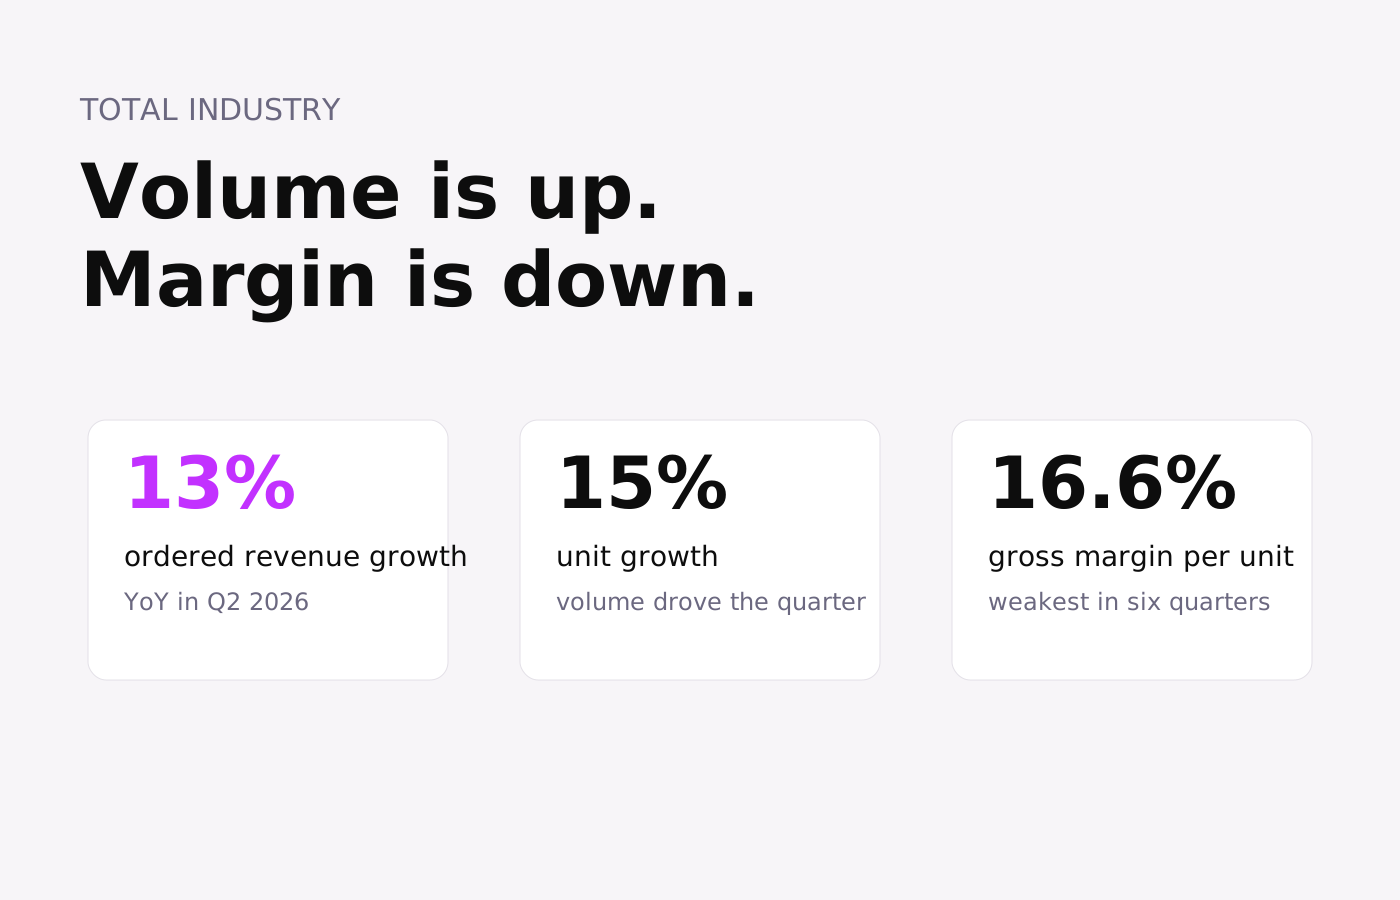
- Volume grew, but profitability didn't. Ordered revenue grew 13% YoY on 15% unit growth - but gross margin per unit compressed 3pp to 17%, the weakest reading in at least six quarters. Brands are buying share at a cost that compounds.
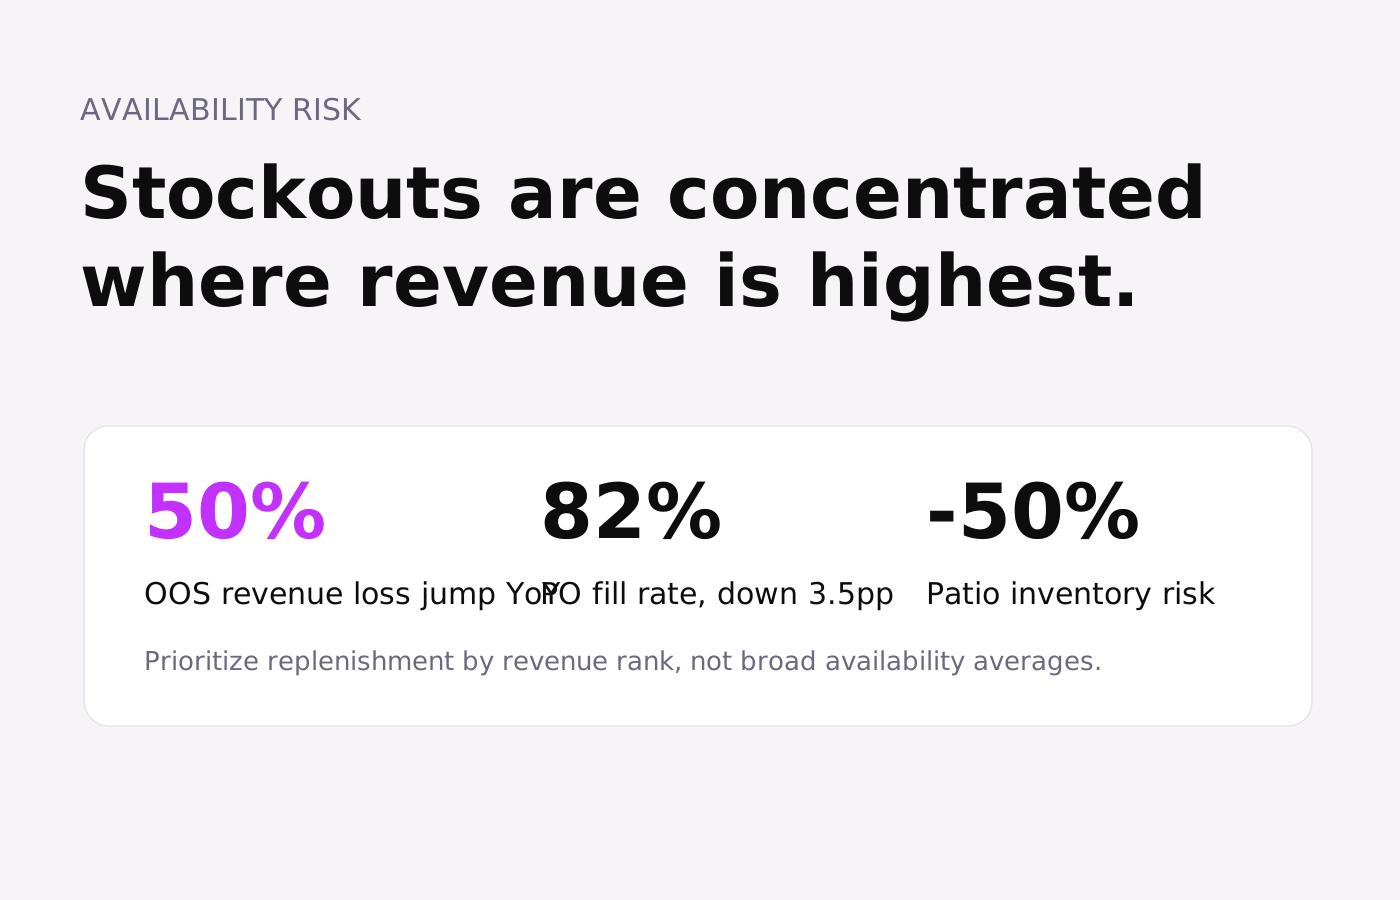
- Prime Day moved the calendar, not the fundamentals. Ad spend, glance views, and OOS losses all surged 24%, 12%, and 50% YoY respectively - but all three comparisons include a full Prime Day event in June that last year's Q2 did not. Strip it out and the underlying trends are more modest. ROAS improving 10% to 5.3x and fill rate holding at 82% are the more durable reads.
This Q2 2026 State of Ecommerce report brings total industry and category breakdowns, with the insights brands need to protect margin and capture demand heading into the back half of 2026.
Key takeaways
Revenue growth industry-wide is coming with real margin compression.
Units grew 15% YoY and ordered revenue rose 13%, but gross margin per unit fell from 20% to under 17%.
Brands are buying volume at a profitability cost.
Q2 delivered the weakest margin reading in at least six quarters, making margin quality the key question behind top-line growth.
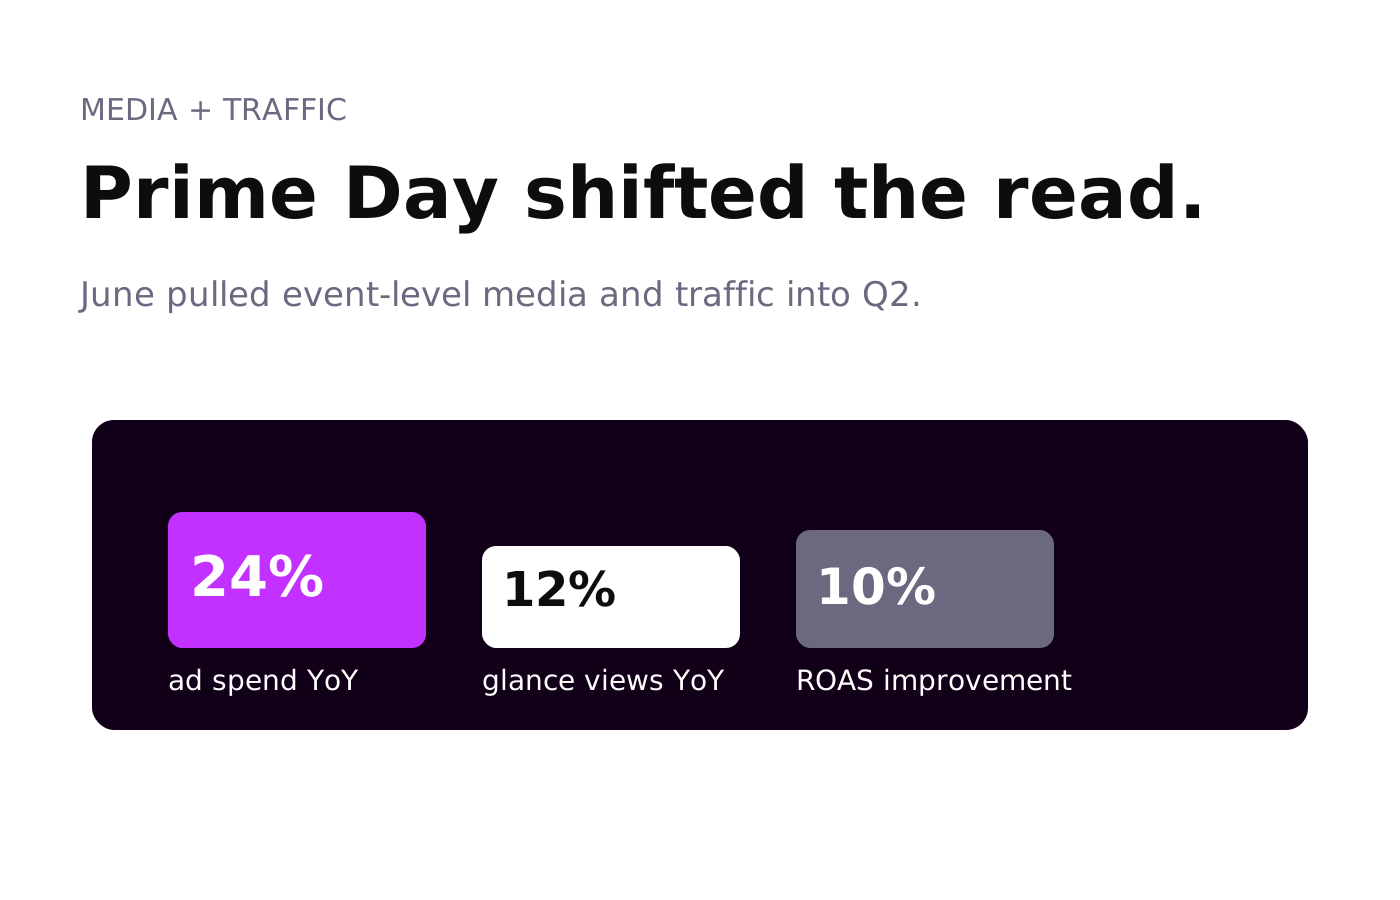
Ad spend surged 24% YoY and glance views rose 12%, partly due to Prime Day timing.
Prime Day fell in June 2026 versus July 2025, pulling event demand into the quarter's YoY comparison.
ROAS improvement is the cleaner signal.
ROAS improved 10% across the quarter, suggesting media efficiency strengthened even as spend and traffic were distorted by the calendar shift.
OOS revenue loss jumped 50% YoY even as Rep OOS% held near-flat.
The divergence confirms shortages are concentrated in higher-revenue ASINs, not broad availability failure.
Patio, Lawn & Garden is the highest-risk category.
On-hand inventory fell sharply entering peak season while fill rate also declined, making replenishment urgency materially higher than other verticals.
Get your Q2 2026 State of Ecommerce Report
Download the Q2 2026 State of Ecommerce report for insights on Prime Day timing, margin compression, retail media efficiency, and availability risk.
Download now