
Q2 2026 INDUSTRY REPORT
The State of Ecommerce: Grocery
The only category that grew revenue without sacrificing margin
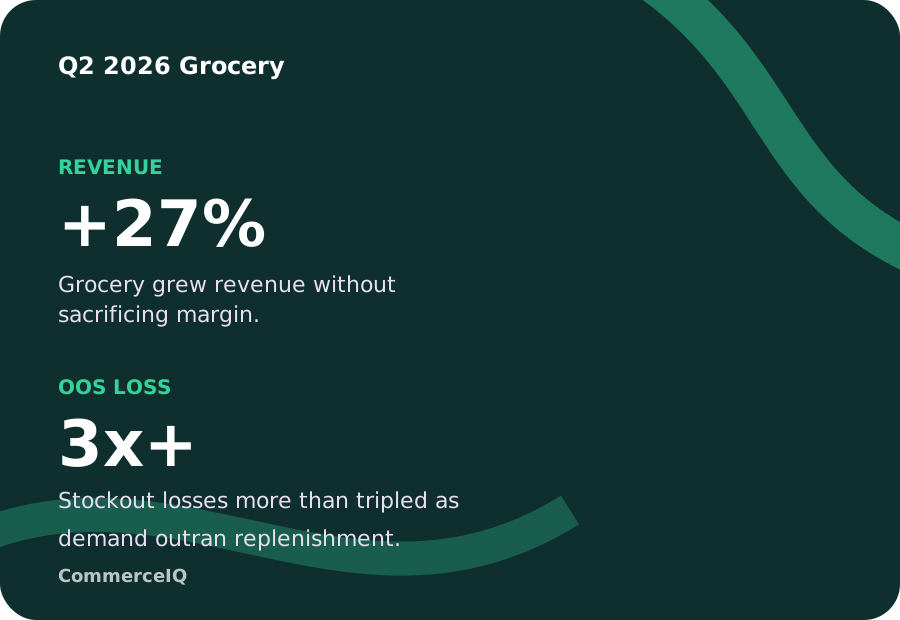
- Revenue grew 27% YoY with gross margin held flat, the healthiest P&L dynamic in the portfolio.
- OOS losses tripled and the OOS rate rose, unlike most categories where Prime Day timing explains more of the increase.
- Demand is outrunning replenishment. Get the data on where Grocery supply chain execution is breaking down.
Download the full category report for the Q2 2026 benchmarks and recommendations.
Key takeaways
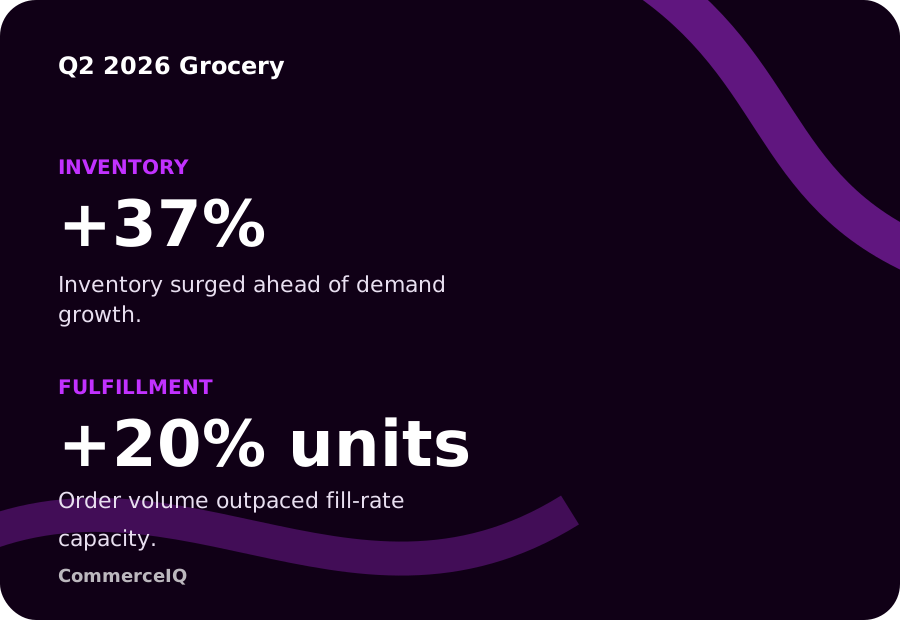
Inventory surged ahead of demand.
On-hand inventory rose 37% YoY, suggesting aggressive forward stocking for continued volume growth.
Fulfillment capacity is lagging demand.
Fulfilled units grew 20% YoY while fill rate fell 8pp to 83%, with June fill rate down to 80%.
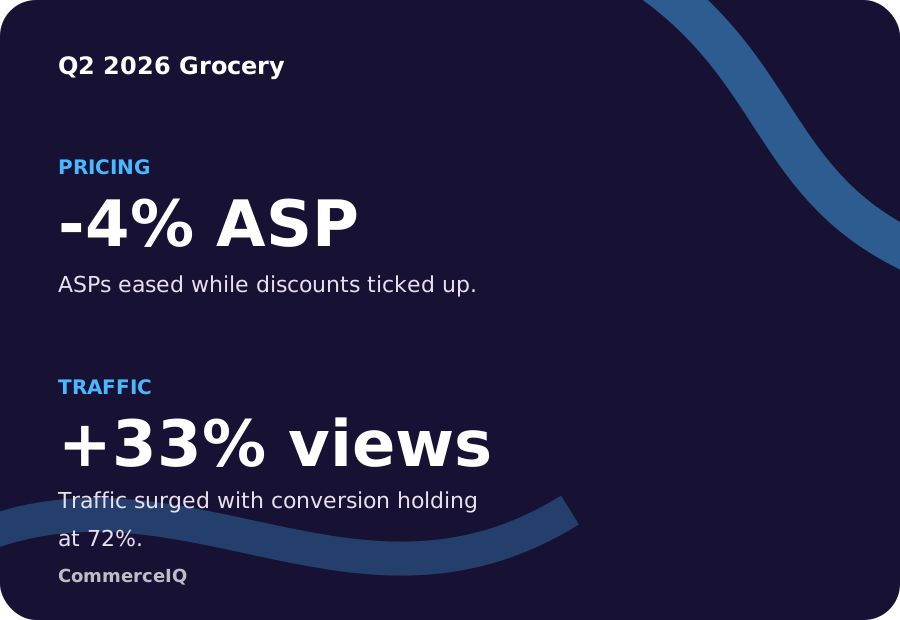
Pricing eased while discounts rose.
ASPs fell 4% YoY to $13.57 as discount rate increased 1pp to 7%, opposite the broader industry trend.
Grocery traffic expanded sharply.
Glance views rose 33% YoY while conversion held at 72%, confirming a high-intent audience.
Grocery delivered the healthiest P&L.
Revenue grew 27% YoY without sacrificing gross margin, driven by unit growth and cost efficiency.
Stockout losses reveal a real revenue gap.
OOS revenue loss more than tripled as high-turn ASIN replenishment failed to keep pace with demand.
Get your Q2 2026 Grocery State of Ecommerce Report
Download the Q2 2026 State of Ecommerce report for Grocery insights on growth, margin, media efficiency, pricing, and availability.
Download now